Buyer Closing Costs CalculatorSeller Closing Costs CalculatorRealtor Commission CalculatorRent Vs. Buy Calculator
Discount Realtor®Cashback Realtor®Buyer Agent

Contact Us

2 Sheppard Avenue East, Unit: 20th Floor Toronto, ON M2N 5Y7 Canada

+1 (647) 228-0115

[email protected]

Support

  • Contact Us
  • Sitemap
  • Blog

Company

  • About PropertyMesh
  • Editorial Policy
  • Disclaimer
FacebookTwitterInstagramLinkedinYoutube
PropertyMesh

© 2026 All rights reserved. All registered trademarks herein are the property of their respective owners. PropertyMesh is owned by Faiza Ahmed Realty Corp. (RECO Registration #4791581) and operates under INTERNATIONAL REALTY FIRM, INC., Brokerage (RECO Registration #4799095).

Head Office: 2 Sheppard Avenue East Unit: 20th Floor Toronto, ON M2N 5Y7 Canada.

Privacy Policy·Terms & Conditions·

Data & Service Disclaimer:
Website Listings: PropertyMesh.ca provides access to live resale listings via IDX (Internet Data Exchange) and VOW (Virtual Office Website) feeds. This information is provided for consumers' personal, non-commercial use and may not be used for any purpose other than to identify prospective properties consumers may be interested in purchasing. Information is deemed reliable but is not guaranteed and should be independently verified.

Trademark & Licensing Notices: The trademarks MLS®, Multiple Listing Service®, REALTOR®, and associated logos are controlled by The Canadian Real Estate Association (CREA) and identify professional real estate services provided by members of CREA. All other trademarks are the property of their respective owners.

    Back to Blog

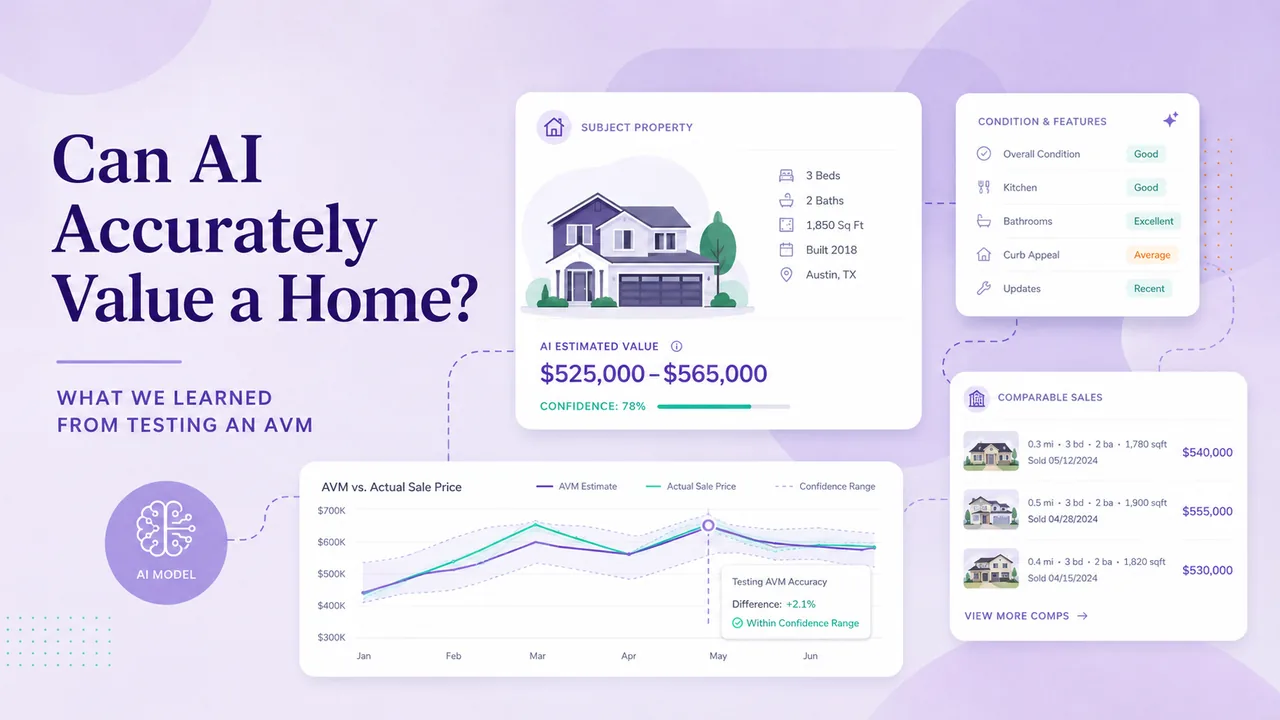
    Can AI Accurately Value a Home? What We Learned From Testing an AVM

    PropertyMesh spent months testing automated valuation architectures — hedonic regression, Random Forest, Gradient Boosting, spatial models and computer vision. This is a dated record of what worked, what didn't, and what we will prioritize when AVM development resumes.

    FA

    Written by Faiza Ahmed

    Last updated on August 12, 2026

    Can AI Accurately Value a Home? What We Learned From Testing an AVM
    On This Page
    Share on XShare on FacebookShare on LinkedInShare on Reddit
    Share on XShare on FacebookShare on LinkedInShare on Reddit

    When we began testing an automated valuation model for PropertyMesh, the initial plan appeared manageable.

    Collect historical transactions. Standardize the property characteristics. Add geographic and market variables. Train several statistical and machine-learning models. Compare their errors. Use the strongest model to estimate the value of an unseen property.

    That was the simplified version of the problem.

    It did not survive contact with real estate data.

    Generating a number was not especially difficult. Approaches such as hedonic regression, Random Forest, Gradient Boosting and spatial models can all produce estimates, and our Gradient Boosting prototype did. The much harder question was whether the number reflected the property well enough to deserve confidence.

    The problems appeared one after another.

    What exactly should the model predict? How should it distinguish an off-market valuation from a sale-price prediction after a property is listed? How do we determine whether two records actually represent comparable homes? How do we prevent a model from appearing highly accurate simply because nearly identical properties from the same building or street remain in its training data?

    Then there was everything the structured data did not contain.

    A database might tell us that a home has three bedrooms, two bathrooms and a finished basement. It cannot adequately describe workmanship, layout flow, renovation quality, or whether a kitchen received a relatively minor cosmetic refresh or a much more substantial rebuild. Materials, views, interior condition and the consistency of improvements throughout the property are often represented poorly or not at all.

    Computer vision appeared to offer a way to recover some of that missing information.

    We processed hundreds of thousands of listing photographs to extract basic image-derived signals. Doing that at scale introduced its own infrastructure requirements: images had to remain associated with the correct properties and listing histories, be stored and retrieved reliably, processed consistently and potentially processed again as the underlying models changed. We also built the code for a much richer condition-scoring layer, but development paused before that system was ever run and validated, so we never learned from our own data whether photographs could support the detailed distinctions a valuation would need.

    As the project progressed, it became clear that the AVM was not just a prediction model. It depended on a data pipeline with substantial ongoing infrastructure requirements. The prediction model was only one component of that system. Properties had to be matched consistently across listing and transaction histories, records had to be cleaned without introducing information that would not have been available on the valuation date, locations had to be resolved accurately enough for spatial comparisons, comparable candidates had to be retrieved efficiently, and every additional source of information introduced its own requirements for processing, validation and maintenance.

    PropertyMesh ultimately paused further development before public deployment. The continuing cost of the data, computing infrastructure, image processing and model maintenance required a larger allocation of resources than we could presently justify.

    What follows is a record of what we built, what we measured and what remained unproven when we paused.
    PropertyMesh AVM project status — August 2026

    This article records findings from the first phase of PropertyMesh AVM research and testing. Development was paused before public deployment because the data, infrastructure, computer-vision processing and ongoing model-monitoring requirements could not be justified within the project’s resource allocation at that stage.

    Development is planned to resume. Because machine learning, computer vision and property-data systems are evolving rapidly, some technical limitations described here may change.

    We are preserving this article as a record of what we tested and observed during this phase of development. Future PropertyMesh AVM testing and research updates will be linked from this page.

    What We Actually Tested

    The PropertyMesh AVM reached the point where we had a trained valuation model and a held-out test set. It never reached the point where we considered the resulting estimates reliable enough for a consumer-facing valuation product.

    The final saved training run used 2,985 closed residential sales drawn from a 36-month lookback period, after excluding transactions below $50,000 and above $25,000,000. Of those, 2,388 records were used for training and 597 were held out for testing.

    The model used 41 property and market features, including characteristics such as living area, bedrooms and bathrooms, taxes, location, neighbourhood price trends and other property- and area-level signals. The promoted model used Gradient Boosting against a log-transformed sale price.

    On the held-out 20% test sample, the model recorded an average percentage error of 18.8%, an average dollar error of $131,317 and an R² of 0.85.

    An R² of 0.85 can sound encouraging. An average percentage error of 18.8% feels much less comfortable when the output is supposed to represent the value of someone’s home. Both figures describe the same model.

    Those numbers also need qualification.

    The holdout was randomly selected. It was not a geographic holdout in which entire areas were excluded from training, and it was not a strictly forward-looking temporal holdout. The training code included time-aware cross-validation, but we do not have a stored geographic-validation result that would justify claiming the model had been tested against unseen local markets.

    For us, that made the 18.8% figure a development result rather than a commercial accuracy claim.

    An AVM can generate an estimate at that stage. The harder question is whether the evidence behind an individual estimate is strong enough that we should show it to a homeowner.

    We did not think we were there yet.

    Better-Looking Numbers Were Not Necessarily Better Evidence

    One of the earlier saved experiments looked considerably stronger on paper.

    A smaller run used 528 properties for training and 131 for testing. It recorded a 14.5% average percentage error and an R² of 0.95. The larger final experiment produced an 18.8% average percentage error and an R² of 0.85.

    We do not interpret that difference as proof that adding more data made the model worse. The experiments were not controlled closely enough for that conclusion.

    But the progression reinforced something important. A highly attractive metric from a relatively small experiment can create more confidence than the underlying test deserves.

    As the project progressed, we became less interested in finding the most impressive number and more interested in knowing exactly what information the model had seen, how the test population had been constructed and whether the result would survive a more realistic valuation setting. That is one reason geographic and strictly time-separated validation would come before treating any accuracy figure as a commercial AVM benchmark in the next phase.

    A note on how to read this article: it is not a benchmark report. The saved PropertyMesh artifacts document a working Gradient Boosting model, a random holdout result and substantial image-processing work. They do not document the full geographic and temporal validation programme we would require before publishing a commercial AVM accuracy claim. What we can document more confidently is what the project achieved, where the evidence remained incomplete and what we would build differently when development resumes.

    The First Problem Was Defining What “Value” Meant

    “Estimate the value of this home” sounds like a clear modelling objective.

    It is not.

    An AVM could be asked to estimate the current value of an unlisted home, the likely selling price if the property were listed today, the expected selling price after the asking price and early market response are known, or even the likely value at some future date.

    Those are related questions, but they are not the same prediction problem.

    An on-market model may have access to the asking price, price changes, days on market, listing descriptions, photographs and other information that becomes available through the marketing process.

    An off-market AVM cannot legitimately rely on many of those signals.

    This distinction matters because the asking price itself carries information. A seller and listing brokerage have already made a pricing decision. A model that is allowed to use that price may perform substantially better at predicting the eventual transaction than a model that has to estimate the property before it reaches the market.

    Combining the accuracy of those two situations into one headline AVM number can therefore produce a misleading impression of how well the model performs for an owner asking, “What is my home worth today?”

    For our work, the more useful starting target was the probable arm’s-length transaction price of a residential property as of a defined valuation date, without depending on a current asking price.

    Even that required additional decisions.

    Should the model predict the sale price directly or model the logarithm of the price? Should older sales first be adjusted to the valuation date, or should time enter the model as a feature? Should condominiums and freehold homes share an architecture? Should geography be represented within one broad model or through local submodels?

    These choices were not implementation details. They determined what the AVM was actually learning.

    Image

    Why Price Per Square Foot Was Useful, but Not a Valuation Model

    Price per square foot is one of the easiest housing metrics to understand.

    It is also easy to overuse.

    The measure helps normalize properties of different sizes, identify unusual transactions and compare activity within relatively homogeneous buildings or property segments. But it assumes a consistency between area and value that real properties frequently violate.

    A smaller condominium can sell for more per square foot than a larger unit. Additional square footage often has diminishing marginal value. A poorly designed 1,000-square-foot unit may not command the same value as another 1,000-square-foot unit with a substantially better layout. Lot characteristics, condition, exposure, parking and location can all alter the relationship.

    We therefore viewed price per square foot as a useful diagnostic and comparable-selection variable rather than the valuation logic itself.

    The Data Pipeline Was Becoming the Actual Product

    Training a model is relatively straightforward when the dataset has already been cleaned, standardized and connected correctly.

    Property data rarely arrive in that condition.

    Some of the most difficult problems occurred before a model generated a prediction. A property could appear under different listing records over time, or be terminated and relisted rather than sold twice. Characteristics could change between listings. Basement descriptions, bedroom counts and other fields were not always represented consistently. Geographic relationships also mattered, because two properties that appeared close in straight-line distance could belong to materially different market contexts. Resolving those issues was part of the valuation problem, not simply preliminary data cleaning.

    More importantly, a machine-learning model assumes that its variables actually mean what their labels imply.

    A “three-bedroom” property may contain three conventional bedrooms or two bedrooms and a space marketed as another bedroom.

    A “finished basement” field does not describe ceiling height, workmanship, natural light, a separate entrance, kitchen facilities, legal status or how much useful living space the basement actually provides.

    “Renovated” can describe anything from new paint and hardware to a major reconstruction.

    When materially different properties share the same coded variables, the model cannot see the distinction. The unexplained price difference becomes noise or, worse, gets attributed to another feature that happens to correlate with it.

    This led to one of the most important lessons from the project:

    A sophisticated model does not repair weak property data. It can simply learn from weak property data more efficiently.

    The pipeline around the AVM therefore needed to determine not only what a field contained, but when that information became available, whether it conflicted with another record and whether it was appropriate to use for the valuation date being tested.

    That last point became especially important with more flexible machine-learning models.

    We Needed an Interpretable Baseline Before We Needed More AI

    The first serious valuation model should not necessarily be the most sophisticated one available.

    It should be the model against which added complexity has to prove its value.

    For us, the natural candidate for that baseline was hedonic regression.

    A hedonic model estimates the relationship between property characteristics and price. Depending on the market and property type, those characteristics could include area, lot size, bedrooms, bathrooms, age, parking, basement information, condition, location and transaction date.

    The attraction was not that we expected a conventional regression to become the final AVM.

    It would force us to examine the data.

    If such a model showed an implausible relationship between bedrooms and price, for example, we could investigate whether the issue came from model specification, inconsistent bedroom classifications, property size or an omitted interaction.

    A more complex model might lower the prediction error while concealing the same underlying data problem.

    Hedonic regression was therefore attractive for two reasons: it could provide an interpretable baseline and act as a diagnostic tool for the rest of the system.

    A study applying automated comparable selection, ordinary least squares, generalized additive models and XGBoost to roughly 1.2 million German residential properties found that XGBoost produced the strongest results overall, but performance still differed among regions and model families. The researchers argued against assuming that one approach should necessarily dominate every market.

    Image

    During development we considered several valuation approaches, including hedonic modelling, Random Forest, Gradient Boosting and spatial methods. The surviving training artifacts, however, only give us enough evidence to report measured performance for the Gradient Boosting implementation. The architectures discussed below should therefore be read as approaches considered and designed around during the PropertyMesh project, not as completed benchmark experiments with stored results. They should not be interpreted as a required architecture for every AVM.

    Production AVMs can use substantially different combinations of statistical models, machine learning, comparable-sales methods, neural networks and spatial techniques depending on their available data, geographic coverage, intended use and testing results.

    Our objective was not to establish a universal AVM stack. It was to understand how architectures that approach the valuation problem differently could each contribute, and what each would demand from the underlying data.

    We Considered Four Core Valuation Architectures

    We did not treat hedonic regression, Random Forest, Gradient Boosting and spatial models as four interchangeable ways to reach the same number.

    They addressed different parts of the problem. Only Gradient Boosting progressed to a completed training run with saved results; the others shaped the design.

    Hedonic Regression: Understanding the Adjustments

    The appeal of hedonic regression was that it would make the relationship between variables easier to inspect.

    It would allow us to ask whether additional living area was behaving sensibly, whether parking appeared to matter differently across locations, whether age interacted with renovation status and how strongly broad geographic variables were influencing the estimate.

    Its weakness was equally apparent.

    Housing relationships are rarely constant.

    Parking can matter substantially more in one location than another. The effect of an additional bedroom depends partly on the size and configuration of the property. Renovation quality may matter differently across price segments. Building age may mean something very different for a poorly maintained property than for a comprehensively renovated one.

    Generalized additive models can relax some of the strict linear relationships while preserving more interpretability than many black-box methods, but complex real estate interactions quickly make the specification more demanding.

    For us, the hedonic architecture remained attractive precisely because other models were more flexible. We needed something that could challenge their output in understandable terms.

    Random Forest: A Different Nonlinear View of the Property

    Random Forest was attractive because it could allow the data to reveal interactions without requiring us to write each one into the model beforehand.

    It could recognize patterns such as a finished basement behaving differently across property types, parking mattering differently by neighbourhood, or older renovated homes behaving differently from older homes without comparable improvements.

    Its value would not only be whether it produced the lowest prediction error.

    It would also give the system a model with a meaningfully different learning structure.

    That mattered for the design.

    If a hedonic model, a Random Forest and a Gradient Boosting model eventually all arrived in roughly the same range, that would be one form of supporting evidence. If they diverged significantly, the disagreement itself would become something worth investigating.

    Was the subject property unusual? Was a major variable missing? Was one model depending disproportionately on location while another responded strongly to size? Was the property near the edge of a market segment represented poorly in the training data?

    We came to view potential disagreement among models as a future uncertainty signal worth testing rather than something that should automatically be averaged away.

    Gradient Boosting: The Strongest Candidate for the Main Tabular Engine

    XGBoost, LightGBM and related Gradient Boosting architectures were particularly attractive for property valuation because they can capture nonlinear effects, interactions, missing-value patterns and complicated combinations of structured variables.

    A boosted model could potentially learn that the relationship between condominium floor level and price depends on the building, view and exposure. It could model diminishing returns to additional area or different condition effects across property segments without requiring us to specify every relationship manually.

    A large German study comparing automated comparable selection, ordinary least squares, generalized additive models and XGBoost across roughly 1.2 million residential properties provides one useful comparison: XGBoost was the strongest overall performer, though performance still differed among regions and model families.

    Gradient Boosting was also the family that progressed furthest at PropertyMesh: it is the only approach for which we have a completed, saved training run with measured results — the 18.8% average-percentage-error development result described earlier in “What We Actually Tested.”

    The Better the Model Became, the More Dangerous Leakage Became

    A flexible model will exploit almost any useful predictive signal available to it.

    That includes signals it should not have.

    If the objective is an off-market valuation, the system cannot quietly learn from a current asking price. If a property field was updated after the valuation date, using it during historical testing gives the model information that would not have existed at the time.

    Post-listing behaviour, later photographs, future transactions, duplicated listing records and market variables accidentally calculated with future information can all make test accuracy appear better than the real production model would achieve.

    That made the valuation date itself important. Features, transactions and comparable evidence had to reflect what was actually knowable at that point in time.

    Greater model sophistication therefore increased the importance of data lineage. We needed to know not only what a feature represented, but when the model would actually have been allowed to know it. A dependable AVM required not only accurate data, but a defensible record of when that data became available.

    Spatial Models: “Nearby” Is Not a Sufficient Definition of Comparable

    Real estate makes the geographic part of machine learning unusually difficult.

    Adding latitude and longitude to XGBoost does not mean the model understands location.

    Two homes a few hundred metres apart can be separated by a railway line, major road, school boundary, neighbourhood transition or substantial difference in housing type.

    Two properties farther apart may compete directly because buyers view them as substitutes.

    Condominiums make this particularly obvious. Units in the same building can share important characteristics, but floor, exposure, view, layout, parking and renovation quality can still produce meaningful differences.

    A spatial architecture therefore needs a more sophisticated representation of relationships.

    That can range from building and neighbourhood effects to distance-weighted models, spatial residual correction, geographic embeddings or graph-based relationships.

    Graph models are particularly interesting because they allow properties to be connected through more than physical distance. But they introduce another modelling decision: what exactly should create an edge between two properties?

    Distance? Building? Similar physical characteristics? The same buyer segment? Transit access? Some combination of all of them?

    The graph still reflects the assumptions made by the developer.

    Spatial Validation Changed How We Thought About Accuracy

    Spatial modelling led directly to a more important problem: spatial validation.

    Suppose a model is trained using sales from several condominium units and then tested on another nearly identical unit in the same building.

    The test observation may technically be unseen.

    The market is not.

    That can be perfectly reasonable if the intended use is valuing another unit in a building where the AVM already has extensive evidence. But it does not tell us how well the model generalizes to a building or neighbourhood it has never encountered.

    The same problem exists at the street and neighbourhood level.

    Randomly splitting transaction records between training and testing can put closely related properties on both sides of the split and make generalization look easier than it really is.

    A dependable AVM therefore needs more than one type of holdout.

    We would want to know how the model performs on future transactions, in withheld geographic areas, in buildings it has not seen, across different property types, and within both dense and sparse transaction markets.

    The question is not simply: What is the model’s error?

    It is: What information did the model have access to before producing that error?

    That became one of the most useful ways to challenge our own results.

    What We Actually Did With Listing Images

    Computer vision became one of the more ambitious parts of the project, but it is important to distinguish what we built from what we actually tested.

    At the basic image-processing level, the system went well beyond a small proof of concept. Across the production dataset, approximately 833,000 listing photographs associated with 115,893 properties were processed for relatively simple image-derived characteristics such as brightness, sharpness and edge density, photo counts and related low-level signals.

    We also developed code for a much richer condition-scoring layer intended to combine image-derived information with the structured property data, examining areas such as room coverage, kitchen and bathroom condition, staging and curb appeal.

    That system did not proceed through full dataset execution and validation. It was never run across the dataset, and the corresponding condition-scoring tables contain no completed observations. We therefore never established from our own results whether photographs could reliably distinguish the kinds of condition, renovation and quality differences that would materially improve a home valuation, and we do not have a PropertyMesh accuracy result for renovation classification, room-condition scoring or the contribution of those visual features to valuation accuracy.

    More importantly, extracting information from an image is not the same as proving that the information improves a valuation. A model might successfully identify a kitchen, flooring material or visual characteristic without establishing whether that feature carries dependable information about the property’s market value. That second question requires validation against actual transactions rather than confidence in the image-recognition system itself.

    We reached the extraction stage of that architecture. We did not complete the validation stage.

    The unresolved question was still the important one. A property record may identify a kitchen; it rarely tells us what was done to that kitchen. One kitchen may have received a cosmetic refresh. Another may represent a substantial renovation. A third may be a high-end custom project. Recognizing that all three photographs contain kitchens is very different from estimating the scope, quality, recency and local market contribution of those improvements — and assigning all three the same “renovated” condition variable would create a false sense of precision.

    Could photographs tell us enough about property condition to justify changing an individual valuation, rather than simply recognizing broad visual characteristics? That was the experiment we built toward but did not complete.

    Image

    What the Vision Model Would Need to Understand

    A genuinely useful system would need to distinguish considerably more detail.

    It would need to examine cabinetry construction and finish, whether cabinetry appeared stock or custom, countertop material and thickness, tile type and dimensions, flooring, appliance quality, plumbing fixtures, lighting, millwork, layout changes, workmanship, apparent age and the consistency of improvements across the rest of the home.

    It would also need to determine whether what appeared new represented a cosmetic refresh, partial renovation, complete mid-range renovation or high-end custom project.

    Those distinctions matter.

    New countertops and painted cabinets are not equivalent to replacing cabinetry, flooring, electrical work, plumbing, appliances and the layout.

    Yet both can look “renovated” to a general image model.

    The output such a system would need to produce was not:

    Kitchen: renovated

    A single broad label like this is the level of output general-purpose image models provide most readily.

    It was closer to:

    What a valuation-grade visual assessment would need to say

    Countertop: likely engineered quartz — Confidence: moderate
    Cabinetry: possibly semi-custom — Confidence: low
    Renovation scope: uncertain
    Apparent renovation age: indeterminate
    Image coverage: incomplete

    That is a much harder computer-vision problem.

    It is also a better representation of the uncertainty in the evidence.

    Independent Research on the Experiment We Did Not Finish

    While we had not completed that experiment ourselves, research published in July 2026 offers a much larger test of almost exactly this problem.

    Researchers used 15,702 condominium transactions in Oslo and 393,914 listing images. Their system first classified images by room type, then used separate computer-vision models to grade the condition of kitchens, bathrooms, bedrooms and living rooms on a five-level scale. Those condition variables were then added to hedonic regression and XGBoost AVMs.

    Room identification was relatively strong, correctly classifying the room type in about 95% of cases.

    Condition was more difficult.

    Most room-specific condition models achieved accuracy around 66% to 73%, while living-room condition classification was approximately 43%. Adding the computer-vision condition variables nevertheless improved the AVMs. MAPE fell from 12.8% to 12.4% for the hedonic model and from 8.0% to 7.7% for XGBoost.

    Those results are meaningful.

    They demonstrate that listing photographs contain information about condition that structured property records do not fully capture.

    But they also frame the question we had left unanswered.

    The research uses broad condition levels based on aggregated human assessments. The authors explicitly note that the models reproduce systematic patterns in subjective human condition judgments rather than replacing those judgments with objective physical measurements.

    A five-level condition classification can improve an AVM statistically.

    It does not necessarily tell us the scope, quality or recency of the improvements behind a photograph.

    That distinction mattered to us.

    The external research demonstrates that broad visual condition signals can improve aggregate AVM accuracy. The standard we had set for ourselves was more granular: could visual evidence support a defensible property-specific renovation adjustment? We did not complete the internal validation needed to answer that question.

    Those are different standards, and the second one is still open for us.

    Renovation Cost and Added Market Value Are Also Different Questions

    Even a much better vision model would solve only half of the problem.

    Suppose computer vision eventually becomes capable of identifying materials, workmanship and renovation scope well enough to estimate the scale of investment a kitchen renovation represents.

    The property is not automatically worth that amount more.

    Renovation cost and market contribution are not the same thing.

    The market impact depends on the neighbourhood, price segment, property type, buyer expectations, age of the improvements, condition of the rest of the home and what competing properties already offer.

    A high-end kitchen can be an important differentiator in one market and an over-improvement in another.

    The complete modelling chain would therefore need to move through several stages:

    Content will load when scrolled into view

    We did not get far enough to complete that chain ourselves. Whether it can be completed reliably remains the unresolved technical question we would return to.

    Listing Photographs Were Another Source of Bias

    There was an additional problem with the evidence itself.

    Listing photographs are created for marketing.

    They are not property inspections.

    Wide-angle lenses, professional lighting, image enhancement, virtual staging and selective room coverage can all change how a property appears.

    The absence of an image may also be informative.

    If a listing contains six photographs of a renovated kitchen but no photograph of the basement, a computer-vision system should not simply assume the rest of the property is consistent with the room it can see.

    This meant the visual pipeline would need to evaluate not only what was shown, but whether the available images were sufficiently representative.

    Missing-room detection, duplicate-image identification, coverage scoring, virtual-staging detection, rendering detection and image-confidence calibration would all add additional layers before the visual variables ever reached the valuation model.

    Our working position was therefore not that computer vision has no place in an AVM.

    It was that, until the richer condition-scoring experiment is actually run and validated, visual evidence is safer as a supporting signal than as the basis for a large property-specific adjustment.

    This is an important point about the status of our computer-vision work.

    We are describing what PropertyMesh built and processed during this phase, not a completed validation of fine-grained visual condition scoring. The richer condition-scoring system was built but never executed across the dataset, so we do not know from our own data whether those signals would have been dependable.

    For that reason, we did not treat the proposed condition score as a demonstrated capability. It remains a question for the next phase of development rather than something PropertyMesh can claim to have validated. When development resumes, the computer-vision layer will need to show that the additional information it extracts produces a measurable improvement in valuation performance before the added processing and infrastructure are justified.

    Comparable Selection Was a Model of Its Own

    A strong prediction engine does not remove the need for comparable evidence.

    If anything, it makes the comparable system more important because it gives the estimate something inspectable.

    The difficult question was not “Which homes are closest?”

    It was “Which transactions represent the market evidence a buyer would actually consider relevant to this property?”

    A nearby home may be a poor comparable because of property type, building quality, school boundary, lot characteristics or renovation level. A transaction farther away may be more relevant because the homes compete for the same buyer.

    Recency creates another trade-off.

    The most recent transaction may be physically dissimilar. The best physical match may have sold too long ago to represent current conditions.

    A useful comparable engine therefore had to function as an evidence system rather than simply a nearest-property search, balancing similarity, geography and time while also determining when no available transaction was sufficiently relevant.

    This is not a lookup function.

    It is another modelling problem.

    Combining the Models Was Not as Simple as Averaging Them

    Designing around several possible valuation architectures raised another question: if multiple models eventually produced estimates, how should those outputs be combined?

    An equal average assumes each model deserves the same influence on every property.

    That did not make sense as a design.

    A condominium in a building with many recent transactions presents a different valuation problem from a rural home with three weak comparables.

    The weighting should be conditional.

    For one property, Gradient Boosting and a building-level comparable engine may have the strongest evidence. For another, a broader hedonic and spatial model may deserve greater influence. For a custom luxury property, all of the automated approaches may be weak.

    Stacking or gating models provide one way to learn these weights, but 2025 research using Oslo housing data illustrates the economic trade-off. Researchers compared a linear model, a comparable-sales method and XGBoost, then combined them using stacked generalization. Combining XGBoost, a linear model and comparable-sales methodology improved MdAPE from 5.24% to 5.17%, but at additional computational cost.

    A production decision therefore cannot stop at: Did adding another model improve accuracy?

    It has to ask: Did it improve accuracy enough to justify the additional data, inference, monitoring and explanation costs?

    That changed how we thought about architectural complexity. Adding another model could improve an accuracy metric while still making the overall product worse if the improvement was too small relative to the additional computation, data dependencies, monitoring and maintenance it required. Future development therefore has to evaluate the economics of each added layer alongside its predictive performance.

    Model Disagreement Could Itself Be Information

    Consider a property where several models return estimates clustered within a relatively narrow range.

    The agreement does not prove the estimate is correct, but when paired with strong comparable evidence and complete property data, it may support greater confidence.

    Now consider a property where the hedonic model, Random Forest, Gradient Boosting model and spatial model differ materially.

    Taking their arithmetic average creates a neat number while concealing the most important result:

    the models are seeing the property differently.

    The disagreement may signal an unusual property, missing condition information, weak comparable coverage, a geographic boundary, an uncommon size or a model operating outside the data where it historically performs well.

    The spread among model estimates can therefore become an input into uncertainty rather than an inconvenience to be hidden.

    A Precise Number Is Not the Same as a Reliable Valuation

    This brought us to another part of the AVM that became more important than the central estimate: uncertainty.

    Tree-based models are effective at generating point predictions. They do not automatically produce trustworthy prediction ranges.

    An AVM that says a property is worth $982,350 appears precise.

    That does not mean it is accurate to the nearest $350.

    A more useful output might be:

    A more honest valuation output

    Estimated value: $980,000
    Probable range: $925,000 to $1,035,000
    Confidence: Moderate
    Why: Recent comparable coverage is strong, but interior renovation quality could not be verified reliably.

    Research into conformal prediction for AVMs demonstrates why this is more complicated than attaching the same percentage range to every estimate. A 2025 study using Oslo housing data found that conventional conformal intervals could be poorly calibrated across different geographic areas. Giving greater calibration weight to geographically relevant observations produced intervals with more consistent local coverage.

    This suggests that uncertainty needs to be modelled with the same respect for geography as the valuation itself.

    An AVM should therefore be evaluated not only on whether its point estimates are close to transaction prices.

    If the system says its range represents a particular level of confidence, actual future sales should fall inside that range at approximately the promised frequency.

    The AVM Needed to Know When Not to Value the Property

    Most consumer valuation products are designed around coverage.

    Enter an address and receive a number.

    From a product perspective, that is understandable.

    From a modelling perspective, it can create the wrong incentive.

    Some properties simply do not contain enough dependable evidence for a high-confidence automated valuation.

    That may occur because the property is unusual, comparable transactions are insufficient, the records conflict, the market is changing rapidly, visual evidence is incomplete or the subject falls outside the range of properties the model understands well.

    For those properties, the proper result may not be a wider range.

    It may be:

    Insufficient evidence for a dependable automated valuation

    Human review is recommended.

    The threshold for reaching that decision will evolve as the technology improves.

    Some of the limitations we encountered, particularly around computer vision, renovation classification and multimodal reasoning, may become materially less significant as the underlying models improve.

    The durable principle is different.

    An AVM should be capable of recognizing when the evidence available to it is weaker than the confidence implied by its output.

    That same boundary between automation and professional judgment extends well beyond valuation. In our task-by-task analysis of which parts of a real estate agent’s work AI can realistically take over, pricing emerged as one of the clearest examples of a task where software can organize market evidence and generate an initial output without automatically resolving the final property-specific judgment. The published analysis similarly separates automated estimates from the broader pricing recommendation, which may also involve physical condition, micro-location, current competition, buyer behaviour and timing.

    Why We Paused the PropertyMesh AVM

    The PropertyMesh AVM project did not pause because the models were unable to generate property estimates.

    Ultimately, PropertyMesh paused further development before public deployment. The decision reflected both the model results we had measured and the infrastructure required to improve them. The saved development run produced an average percentage error of 18.8%, and the holdout was randomly selected rather than geographically or temporally separated. Those results were useful for development, but they were not strong enough for us to present the system to homeowners as a dependable valuation product.

    There was also a continuing cost question. Maintaining transaction histories, property identity, geospatial processing, image handling, model retraining, monitoring and eventually uncertainty calibration would create recurring operating costs rather than a one-time development expense. Every additional model or data source therefore had to justify not only its technical complexity but the incremental improvement in valuation performance it produced.

    At the stage we had reached, we did not yet have enough evidence that the expected improvement in valuation performance would justify that continuing infrastructure commitment. That is different from concluding that a more advanced system could not work. It meant that further development needed to demonstrate measurable gains before PropertyMesh allocated additional resources to operating and maintaining the larger architecture.

    The project therefore became less about whether machine learning could produce a number and more about what would be required to support that number. Producing an estimate was relatively straightforward. Maintaining the property data, transaction history, comparable evidence, validation framework and monitoring necessary to determine when that estimate should or should not be trusted was the harder part.

    What the First Phase Changed About Our Next Architecture

    The sections that follow describe design decisions we plan to test when PropertyMesh AVM development resumes. They are informed by the first testing phase, but they should not be read as claims that every component described below was deployed in the original system.

    The Infrastructure Problem Changed How We Would Build the Product

    The infrastructure requirements also affected how often a valuation would need to be recomputed. Many characteristics of a property remain unchanged between transactions, while market evidence changes continuously. Rebuilding every component of a valuation every time a user requests an estimate would therefore be unnecessarily expensive.

    When PropertyMesh AVM development resumes, we do not plan to design the system so that every user request activates the entire modelling pipeline from the beginning.

    A better architecture would separate work that can be prepared in advance from work that genuinely needs to happen when a valuation is requested.

    Much of the expensive work does not need to occur in the critical frontend path.

    Property records can be cleaned ahead of time. Entity matching can be maintained continuously. Geocoding does not need to be repeated whenever someone views the same home. Candidate comparable sets can be indexed. Market features can be refreshed on a schedule. Image-derived features can be stored once they have been calculated.

    The property page should therefore not trigger the equivalent of: find the property, clean its history, geocode it, search the entire transaction database, process 30 photographs, execute every model and then render the page.

    The user should begin from a valuation-ready property state.

    A Two-Speed AVM Makes More Sense

    That points toward a two-speed architecture when development resumes: the system would separate conceptually into a fast valuation layer and a deeper analysis layer.

    The fast layer would operate on prepared structured features and cached market information. Lightweight hedonic and Gradient Boosting predictions, an existing comparable set and a current confidence state could be retrieved very quickly.

    For many conventional properties, that may be enough.

    The deeper layer would be reserved for cases where the first stage produces weak evidence, model disagreement or an unusual property.

    That layer could expand the comparable search, invoke more computationally intensive spatial analysis, run specialized visual processing or ultimately request human review.

    This changes the economics of the AVM.

    The expensive model is no longer automatically invoked because someone viewed a property.

    It is invoked because the property actually needs more analysis.

    This is the architecture PropertyMesh plans to test, not an industry-wide requirement.

    Recalculate Because the Evidence Changed, Not Because the Page Was Viewed

    The same logic applies to valuation freshness, and it is a design principle we intend to carry into the next phase.

    A property page needs to be responsive every time it loads.

    A property valuation does not necessarily need to be recomputed every time the page loads.

    Suppose an estimate was calculated recently and none of its material inputs have changed.

    There is little value in paying to generate the identical estimate again.

    The existing result can be served immediately while the backend determines whether anything relevant has changed.

    A recalculation might instead be triggered when a new comparable transaction occurs, the subject property is listed, its asking price changes, a new transaction appears within the building, new property information becomes available, new images are added or the underlying model is retrained. These are examples rather than an exhaustive list.

    Revalue the property because the evidence changed, not because somebody refreshed the page.

    The frontend and valuation engine can therefore operate on different refresh cycles.

    The page can remain highly cached and responsive while the valuation state updates according to changes in evidence.

    Comparable Search Should Not Begin With the Entire Market Every Time

    The same approach can reduce the cost of spatially aware comparable selection.

    The AVM should not search millions of transactions from scratch for every valuation.

    Much of the plausible comparable universe can be indexed in advance according to geography, building, property type, size, lot characteristics, age and historical market relationships.

    The live process then ranks a much smaller set of plausible candidates according to current similarity and recency.

    Conceptually:

    Content will load when scrolled into view

    This preserves responsiveness without reducing the comparable engine to a static neighbourhood lookup.

    Computer Vision Should Stay Out of the Critical Request Path

    Our experience makes this particularly important.

    There is little reason to repeatedly process the same property photographs every time a valuation is requested.

    When visual analysis is justified, its outputs should be converted into structured features and stored.

    More importantly, given the validation gap we identified, computer vision should not automatically run for every property merely because images are available. Processing hundreds of thousands of photographs is technically possible, but technical feasibility does not establish economic or predictive value. Before a richer image pipeline becomes part of the production AVM, it will have to demonstrate that the information recovered from photographs improves valuation accuracy enough to justify the additional processing, storage, validation and monitoring.

    Consider a standardized condominium where the core models agree closely, the building has numerous recent transactions and the subject falls comfortably within the model’s familiar data.

    Processing dozens of images may add cost without materially changing the result.

    Now consider a property where the models disagree and the listing suggests substantial renovations that are not represented in the structured data.

    Visual analysis becomes more valuable.

    This creates a different principle:

    Use additional compute when it is likely to provide additional information.

    Computer vision becomes an escalation step rather than a mandatory stage.

    Confidence Can Allocate Compute

    This is one of the architectural ideas we will take most seriously when development resumes.

    Confidence should not exist only as a number shown to the user.

    It can also determine how much work the backend performs.

    A high-confidence property with strong data, strong comparables and tight model agreement can stop after the inexpensive models.

    A moderate-confidence property can trigger deeper comparable and spatial analysis.

    A low-confidence property can justify specialized image analysis or another model.

    A property that remains highly uncertain after those stages can be routed to human review or receive no automated valuation.

    The system becomes a computational funnel rather than a fixed pipeline.

    Confidence here should not be defined solely as model agreement. Deciding when deeper computation or human review is warranted would draw on calibrated uncertainty, comparable sufficiency, model disagreement and out-of-distribution signals together.

    A standard property with excellent evidence should not consume the same computational resources as a renovated waterfront property with few comparable transactions.

    The better product-management question is therefore not: How do we make every valuation as computationally sophisticated as possible?

    It is: What is the least amount of computation required to reach a defensible confidence level for this particular property?

    That is where modelling accuracy, infrastructure cost and frontend performance begin to align.

    The Frontend Should Never Wait for the Entire AVM

    From the user’s perspective, none of this backend complexity needs to result in a slow interface.

    The property page can immediately display the most recent valid valuation state, including the estimate, probable range, confidence level and last refresh time.

    More detailed information can load progressively.

    If the backend determines that new evidence warrants recalculation, the system can update the valuation when the new analysis is complete rather than forcing every page view to wait for the full pipeline.

    This separates two concepts that are easy to confuse:

    Page freshness and valuation freshness are not the same thing.

    The page should always be fast.

    The valuation should be recomputed when its evidence becomes materially stale.

    What We Will Prioritize When AVM Development Resumes

    We will approach the next phase differently because of what the earlier testing revealed.

    The priority will not be adding more models.

    The next phase will prioritize:

    1. Define the valuation target and preserve point-in-time data lineage. Separate off-market and on-market modelling, establish strict valuation dates and record when every feature became available.
    2. Make property identity and data quality dependable. Resolve property, parcel, unit and building records before optimizing prediction accuracy.
    3. Maintain an interpretable baseline. Use hedonic or generalized additive modelling alongside nonlinear models so improvements can be examined rather than accepted only because an error metric declined.
    4. Test Gradient Boosting and Random Forest under spatially and temporally honest holdouts.
    5. Build the comparable engine as an evidence system rather than a proximity search. Comparable selection should account for property similarity, geography, market segment and time.
    6. Introduce calibrated uncertainty and explicit abstention before maximizing property coverage.
    7. Design production around valuation-ready property states, precomputed comparable candidates and evidence-driven revaluation rather than rebuilding the complete valuation stack for every page request.
    8. Retest computer vision against a real-estate-specific renovation and material taxonomy. The objective will be to determine whether newer models can reliably distinguish renovation scope, materials, quality, apparent age and other characteristics at a level useful for property-specific valuation—not simply classify a room as renovated or unrenovated.
    9. Use calibrated uncertainty, comparable sufficiency, model disagreement and out-of-distribution signals to determine when deeper computation or human review is warranted.
    10. Measure the economics of every additional model alongside its improvement in valuation performance.

    The last point is easy to overlook when AVMs are discussed primarily as machine-learning projects.

    A 0.1 percentage-point improvement in test error may be statistically interesting.

    It may not be economically sensible if achieving it doubles inference cost, complicates the explanation system and creates another model that has to be monitored indefinitely.

    So, Can AI Accurately Value a Home?

    Under the right conditions, yes.

    AI and statistical AVMs can produce useful and sometimes highly accurate estimates for properties that are well represented in reliable data and supported by relevant transactions.

    That answer becomes much more conditional when the home is unusual, market evidence is thin, records are inconsistent, renovations materially affect value or the model is operating outside the type of property and location it understands well.

    Our development work did not point to one algorithm that solved the entire problem.

    It pointed toward a future system in which hedonic regression would provide interpretability, Random Forest would contribute an independent nonlinear view, Gradient Boosting — the engine we actually trained and measured — would handle complex structured relationships, spatial models would represent local market behaviour, a comparable engine would provide inspectable evidence, and computer vision would contribute only once its observations were validated as reliable enough to improve the valuation.

    Around those models sits the part that ultimately mattered most: data quality, temporal discipline, uncertainty calibration, monitoring, cost controls and the ability to abstain.

    Computer vision will improve.

    Multimodal models will improve.

    Spatial architectures will improve.

    The point at which an AVM can confidently automate more of the property judgment will almost certainly move.

    But there is a principle we would retain regardless of how capable the underlying AI becomes:

    A trustworthy AVM should not be judged only by its ability to generate an estimate. It should be judged by its ability to show why that estimate deserves confidence, recognize when the evidence is weak and avoid spending unnecessary computational effort once sufficient evidence already exists.

    The work answered a more useful question than whether AI can generate an estimated home value. It showed us how much additional data engineering, validation and ongoing operating work stood between generating an estimate and being prepared to defend it.

    When PropertyMesh resumes development, the objective will not simply be to add more models. Each additional component will have to demonstrate that it improves the valuation enough to justify the complexity and continuing cost it introduces.

    Building the estimate turned out to be the easy part. Building the system that could show when the estimate deserved to be trusted was the real AVM project.

    About this PropertyMesh AVM research

    This article documents a specific phase of PropertyMesh AVM research and development rather than attempting to serve as a permanently current description of the state of automated valuation technology.

    Some technologies, model architectures and limitations discussed here will evolve. Where later PropertyMesh testing materially changes our findings, we intend to publish follow-up research rather than silently rewriting the original development history.

    Original research phase documented: 2026
    Project status: Development planned to resume
    Future AVM research updates: Will be linked from this page as they are published

    Editorial Disclaimer & Legal Notice
    Editorial Note: This article documents PropertyMesh research and testing toward an automated valuation model during a specific development phase. Observations about model behaviour and computer-vision capability reflect the tools and data available to us at the time of that testing, and are professional observations rather than performance claims about any commercial product.This article provides general educational information and does not constitute legal, financial, appraisal or other professional advice. Automated valuation estimates are not appraisals. Real estate practices and professional obligations vary by jurisdiction. AI-generated information should be independently reviewed and verified before it is used in a property decision or transaction.
    FA

    About the author:

    Faiza Ahmed

    As the founder of PropertyMesh, Faiza Ahmed is dedicated to making real estate more transparent and cost-effective. While she advocates for more transparent, flexible fee structures so sellers can keep more of their equity, her core focus is empowering buyers and sellers to make informed decisions. Faiza is a licensed real estate broker registered with the Real Estate Council of Ontario (RECO Registration #4791581) and an active member of the Toronto Regional Real Estate Board (TRREB).

    Follow the expert:LinkedIn
    ArchitectureWhat we wanted from it
    Hedonic regressionAn interpretable baseline and understandable relationship between characteristics and price
    Random ForestA nonlinear model with a different learning structure from regression and boosting
    Gradient BoostingA strong tabular prediction engine capable of modelling complex interactions
    Spatial modelsA way to represent local price relationships that ordinary property fields could not fully capture
    StageWhat happensApproximate role
    Prepared property stateData cleaning, entity matching, geocoding, market features and cached outputsMostly offline or scheduled
    Tier 1Hedonic baseline, Gradient Boosting, basic comparable scoringFast and inexpensive
    Tier 2Deeper spatial and comparable analysisTriggered when uncertainty rises
    Tier 3Computer vision or specialized modelsUsed only when the expected information gain justifies it
    Tier 4Human review or abstentionUsed when automation cannot establish sufficient confidence