Buyer Closing Costs CalculatorSeller Closing Costs CalculatorRealtor Commission CalculatorRent Vs. Buy Calculator
Discount Realtor®Cashback Realtor®Buyer Agent

Contact Us

2 Sheppard Avenue East, Unit: 20th Floor Toronto, ON M2N 5Y7 Canada

+1 (647) 228-0115

[email protected]

Support

  • Contact Us
  • Sitemap
  • Blog

Company

  • About PropertyMesh
  • Editorial Policy
  • Disclaimer
FacebookTwitterInstagramLinkedinYoutube
PropertyMesh

© 2026 All rights reserved. All registered trademarks herein are the property of their respective owners. PropertyMesh is owned by Faiza Ahmed Realty Corp. (RECO Registration #4791581) and operates under INTERNATIONAL REALTY FIRM, INC., Brokerage (RECO Registration #4799095).

Head Office: 2 Sheppard Avenue East Unit: 20th Floor Toronto, ON M2N 5Y7 Canada.

Privacy Policy·Terms & Conditions·

Data & Service Disclaimer:
Website Listings: PropertyMesh.ca provides access to live resale listings via IDX (Internet Data Exchange) and VOW (Virtual Office Website) feeds. This information is provided for consumers' personal, non-commercial use and may not be used for any purpose other than to identify prospective properties consumers may be interested in purchasing. Information is deemed reliable but is not guaranteed and should be independently verified.

Trademark & Licensing Notices: The trademarks MLS®, Multiple Listing Service®, REALTOR®, and associated logos are controlled by The Canadian Real Estate Association (CREA) and identify professional real estate services provided by members of CREA. All other trademarks are the property of their respective owners.

    Back to Blog

    How to Evaluate a Neighbourhood Before Buying or Renting

    A research-backed guide to daily life, comfort and long-term fit — how to combine public data with direct observation before committing to a property.

    FA

    Written by Faiza Ahmed

    Last updated on August 11, 2026

    How to Evaluate a Neighbourhood Before Buying or Renting
    On This Page
    Share on XShare on FacebookShare on LinkedInShare on Reddit
    Share on XShare on FacebookShare on LinkedInShare on Reddit

    A home can be renovated. Its surrounding neighbourhood is much harder to change.

    Yet buyers and renters often spend most of a showing examining the kitchen, bedrooms, finishes and storage. The neighbourhood may receive only a quick drive-through, a glance at an online map or a general question about whether the area is “good.”

    That is not enough.

    As a real estate broker, I have seen how differently people can experience the same neighbourhood. A lively downtown location may be ideal for someone who values transit, restaurants and activity, but exhausting for someone who is sensitive to noise. A quiet residential street may offer space and privacy, but create a difficult routine for a household that does not drive.

    There is no universally best neighbourhood. The more useful question is:

    Does this neighbourhood support the way you actually live?

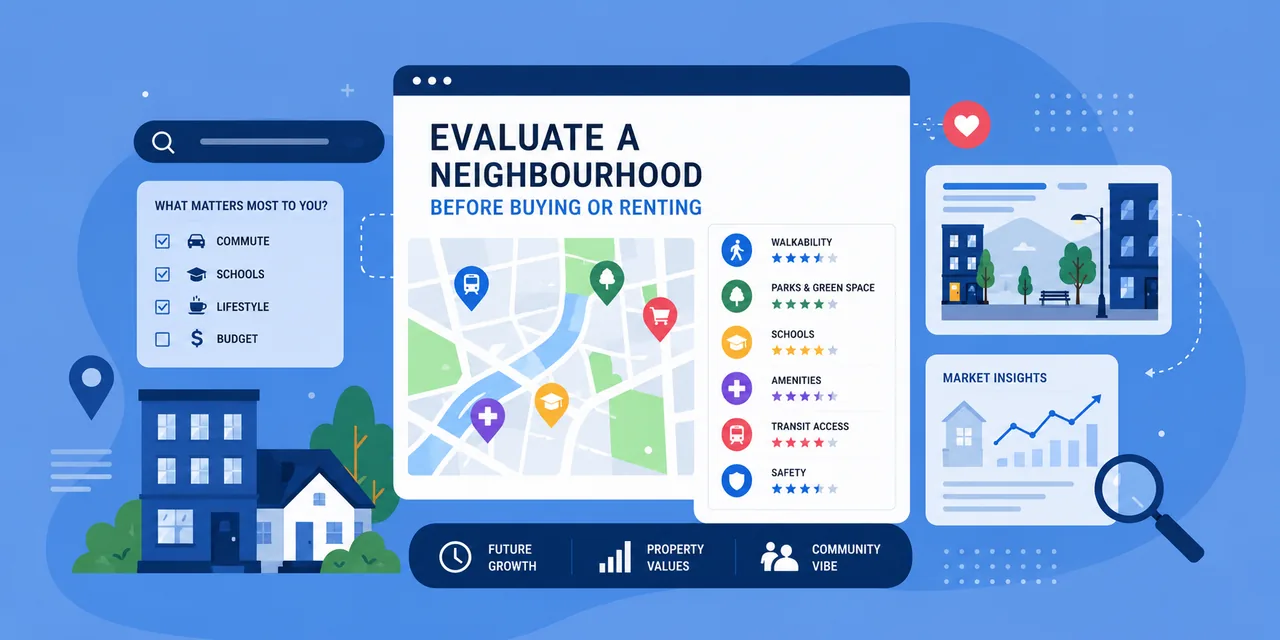
    To better understand why features such as walkability, green space, public spaces and street design can influence everyday life, read my companion guide on how neighbourhood design shapes quality of life.

    Image

    A meaningful neighbourhood evaluation should combine four forms of investigation:

    • Research, which helps explain why neighbourhood conditions matter.
    • Public data, which can reveal patterns involving transportation, access, development, safety and environmental conditions.
    • Direct observation, which shows how the neighbourhood functions at street level.
    • Personal priorities, because the same conditions do not affect every household in the same way.

    This guide brings those four elements together so buyers and renters can evaluate a neighbourhood more carefully before committing to a property.

    Begin With Your Life, Not a List of Neighbourhoods

    Before comparing locations, write down what your household needs from a neighbourhood.

    A neighbourhood can perform well on conventional measures and still be a poor personal fit. Walkability has limited value when the places within walking distance are not the places you use. A nearby subway station may not solve your commute if reaching work still requires several transfers. A large park may be attractive but irrelevant if there is no convenient entrance from your side of the neighbourhood.

    Separate your requirements into three categories.

    Daily necessities

    These are the destinations and services you expect to use regularly:

    • Workplace or school
    • Public transit
    • Grocery store
    • Pharmacy
    • Childcare
    • Medical services
    • Parks and recreation
    • Family or personal support network

    Quality-of-life preferences

    These influence how comfortable and enjoyable the neighbourhood feels:

    • Quiet or active surroundings
    • Restaurants and cafés
    • Tree-lined streets
    • Waterfront access
    • Cultural institutions
    • Community spaces
    • Nightlife
    • Privacy
    • Architectural character

    Future considerations

    Your requirements may change during the period you expect to live there:

    • Starting or growing a family
    • Working from home
    • Aging in place
    • Changes in mobility
    • Caring for a family member
    • Changing employment
    • Reducing dependence on a vehicle
    • Selling or renting out the property later

    A buyer expecting to stay for ten years should place more weight on long-term needs. Renters may have greater flexibility, but moving still involves time, expense and disruption.

    Faiza’s Field Note

    Clients sometimes begin with a list of neighbourhood names because they have heard those areas are desirable. I prefer to begin with the client’s actual week. Where do they travel? What do they carry? Who depends on them? What time do they return home? The answers often produce a very different shortlist.

    Image description

    The Three-Layer Neighbourhood Evaluation

    A complete evaluation should examine three overlapping layers.

    Layer 1: Daily life
    Can you reach work, transit, groceries, schools, parks and essential services without creating unnecessary difficulty?

    Layer 2: Comfort and risk
    What will you experience from traffic, noise, construction, weather, building conditions and environmental hazards?

    Layer 3: Long-term fit
    Will the neighbourhood continue to support your finances, household needs and preferred lifestyle?

    The goal is not to find a neighbourhood without trade-offs. It is to recognize those trade-offs before buying or renting the property.

    1. Test Walkability Through Real Destinations

    Walkability is not simply the presence of sidewalks or a number displayed beside a listing.

    What the research tells us

    Canadian research has found that neighbourhood walkability is positively associated with transportation-related physical activity among adults. A Statistics Canada study linking the Canadian Active Living Environments database with national health surveys found that walkability was associated more consistently with transportation-based activity than with recreational activity. The findings also differed by age, demonstrating that the same built environment may not affect children, adults and older residents in identical ways.

    An Ontario study following almost 959,000 adults found that people younger than 65 living in highly walkable neighbourhoods had a lower ten-year incidence of diabetes than comparable adults in low-walkability areas. The study was observational, so it supports an association rather than proving that neighbourhood design alone caused the difference.

    A broader systematic review of walkability and health outcomes found strong longitudinal evidence connecting walkability with obesity, type 2 diabetes and hypertension outcomes in the expected direction. Again, these findings describe population-level relationships, not guaranteed outcomes for every individual.

    Public data you can check

    Statistics Canada’s Canadian Active Living Environments 2.0 dataset, or Can-ALE 2.0, provides standardized information about how supportive neighbourhood built environments may be for active transportation. It was calculated for dissemination areas across Canada and is intended to support research into relationships between neighbourhood form, physical activity and health.

    Statistics Canada’s Proximity Measures Database provides ten measures and a composite indicator representing neighbourhood-level access to services and amenities. Values are normalized from 0 to 1, with higher values indicating greater relative proximity.

    Its newer Spatial Access Measures evaluate potential access to amenities using different modes of transportation. This is helpful because an amenity may be accessible by car but difficult to reach on foot, by bicycle or by transit.

    Toronto also publishes a pedestrian network based partly on the City’s sidewalk inventory, although the corresponding Open Data entry is currently marked as retired. It may still be useful historically, but readers should verify whether a newer City tool or replacement dataset is available before relying on it.

    What to observe in person

    Choose five destinations you would regularly use, such as:

    • A grocery store
    • A transit stop
    • A pharmacy
    • A park
    • A school, childcare facility or café

    Walk the actual routes from the property. Notice:

    • Whether the sidewalks continue for the full route
    • The number and difficulty of road crossings
    • Vehicle speeds
    • Lighting and visibility
    • Shade and weather protection
    • Hills and steep grades
    • Snow-storage areas
    • Construction obstructions
    • Benches and resting places
    • Accessibility for strollers, wheelchairs, mobility devices or grocery carts

    A grocery store may appear six minutes away on a map but require crossing a wide arterial road or walking through a large surface parking lot.
    Faiza’s Field Note

    I do not consider a destination conveniently walkable simply because a map says it is eight minutes away. I look at what happens during those eight minutes. One difficult intersection or isolated stretch can completely change whether the route is practical.

    2. Measure Access, Not Just Distance

    A neighbourhood may contain many amenities without providing convenient access to them.

    What the research tells us

    Statistics Canada’s proximity-measures methodology does more than identify the nearest amenity. It uses a gravity-style model that considers the distance to services and the amount or size of the services available within a defined range.

    This distinction matters. A neighbourhood with one small grocery store may not offer the same level of practical access as an area with several options. A park one kilometre away may not be usable when the walking route is indirect or obstructed.

    Statistics Canada research involving approximately 46,000 individuals across almost 6,500 neighbourhoods in 29 Canadian metropolitan areas also found relationships between life satisfaction and certain neighbourhood conditions. Among respondents in the lowest family-income group, proximity to public transit and access to parks were positively correlated with life satisfaction, while crime was negatively correlated. The results differed for other income groups, reinforcing the idea that neighbourhood conditions do not affect everyone equally.

    Public data you can check

    The Proximity Measures Data Viewer allows users to explore relative access to:

    • Employment
    • Grocery stores
    • Pharmacies
    • Healthcare
    • Childcare
    • Primary schools
    • Secondary schools
    • Parks
    • Libraries
    • Public transit

    The indicators are useful for comparison, but they should not be interpreted as a guarantee that a particular service will meet your household’s needs.

    Toronto’s Parks and Community Recreation Centres Map allows residents to search for nearby parks, recreation centres and specific amenities. Filters can help distinguish a general green area from a park with a playground, pool, dog area, sports field or community centre.

    What to observe in person

    For each important amenity, ask:

    • Is it open when I would use it?
    • Does it provide the service I actually need?
    • Is the route comfortable in winter?
    • Is there a safe crossing?
    • Is the entrance on my side of the neighbourhood?
    • Would I realistically make this trip while carrying groceries or accompanying a child?
    • Is the facility accessible to someone with limited mobility?
    Faiza’s Field Note

    A neighbourhood can look well served on a map because it contains several destinations. That does not mean those destinations fit the client. I ask whether the grocery store is affordable for them, whether the park has the facilities they need and whether the route works as part of an ordinary day.

    3. Evaluate the Commute Door to Door

    “Minutes from transit” is not a complete description of a commute.

    What the research and data tell us

    Statistics Canada’s Housing and Transportation Cost Index was created to expand the meaning of housing affordability beyond the cost of the home itself. It combines estimated housing and transportation expenses to show how location can affect the overall cost carried by a household.

    The accompanying Statistics Canada tables provide estimates at the census-subdivision and aggregate-dissemination-area levels. These are broad comparative measures, not individual household budgets, but they support an important principle:

    A less expensive home is not necessarily a less expensive location.

    A lower rent or mortgage payment may be offset by vehicle ownership, fuel, parking, insurance, transit fares or substantially longer travel times.

    Public data you can check

    The TTC Trip Planner provides:

    • A trip planner
    • Route maps
    • Route and stop schedules
    • Live service alerts
    • Planned service changes
    • Accessibility information

    The trip planner covers travel throughout the Greater Toronto and Hamilton Area, while service advisories can reveal closures, construction and diversions that a standard route map may not show.

    What to observe in person

    Complete the full trip at the time you would normally travel. Include:

    • Time from the front door to the stop
    • Waiting time
    • Transfers
    • Walking between connections
    • Service frequency
    • Crowding
    • Reliability
    • The final walk to work or school
    • Evening and weekend service
    • Alternative routes during delays

    Drivers should test weekday congestion and parking availability. Cyclists should inspect whether the route uses protected infrastructure, trails, painted lanes or mixed traffic.

    A useful comparison is: Housing cost + transportation cost + time cost

    Faiza’s Field Note

    I encourage clients to test the commute before becoming emotionally attached to a property. A beautiful home can quickly lose its appeal when the daily journey is unreliable, expensive or much longer than expected.

    4. Visit the Neighbourhood at Different Times

    A showing is a snapshot. A neighbourhood is a changing environment. No dataset can fully capture how a street operates at every hour of the day.

    Visit during weekday rush hour

    Observe:

    • Vehicle congestion
    • Transit crowding
    • School pickup and drop-off
    • Delivery traffic
    • Travel time
    • Parking availability

    Visit in the evening

    Observe:

    • Street and pathway lighting
    • Noise
    • Pedestrian activity
    • Restaurant and nightlife traffic
    • Whether the route from transit feels comfortable
    • Whether businesses remain open or the area becomes inactive

    Visit on a weekend

    Observe:

    • Park use
    • Community activity
    • Events
    • Recreational noise
    • Visitor parking
    • The overall pace of the area

    Walk rather than completing every visit from inside a vehicle. Stay long enough to notice patterns.

    Faiza’s Field Note

    Midday showings can make almost any residential street appear peaceful. I encourage clients to return during the period that matters most to them, especially the evening commute or the time they would normally be trying to sleep.

    Image

    5. Listen for Noise Instead of Assuming Quiet

    Noise can be easy to miss during a short and busy property showing.

    What the research tells us

    The World Health Organization’s environmental-noise guidance identifies transportation, railway, aircraft and leisure noise as public-health concerns. WHO evidence links excessive environmental noise with annoyance, sleep disturbance, cardiovascular effects and other health outcomes.

    WHO guidance on noise and health also emphasizes bedroom conditions because nighttime noise can affect sleep even when residents become accustomed to the general sound of an area.

    This does not mean a short visit can measure medical risk. It means noise deserves more attention than it normally receives during a showing.

    Public information you can check

    Maps and aerial imagery can help identify likely noise sources:

    • Highways and arterial roads
    • Rail corridors
    • Streetcar tracks
    • Airports and flight paths
    • Fire, police and ambulance stations
    • Entertainment areas
    • Industrial and loading uses
    • Construction projects

    HealthyPlan.City also includes a neighbourhood-level noise indicator for supported Canadian municipalities, including Toronto. It should be treated as a screening tool rather than a precise sound measurement for an individual home.

    What to observe in person

    Listen from the room where quiet matters most. For an apartment or condominium:

    • Stand in the bedroom
    • Turn off music and mechanical systems temporarily
    • Listen with the windows closed
    • Listen with the windows open where possible
    • Notice hallway, elevator and garbage-room noise
    • Ask about loading, waste collection and construction schedules

    Potential sources include:

    • Traffic
    • Streetcars and trains
    • Aircraft
    • Patios and nightlife
    • Schoolyards and sports fields
    • Loading docks
    • Parking-garage doors
    • Elevators
    • Mechanical equipment
    • Waste collection
    Faiza’s Field Note

    Buyers and renters often speak throughout the entire showing. I recommend taking one quiet minute in the bedroom. Stop talking and listen. That pause can reveal something that would otherwise be discovered only after moving in.

    6. Evaluate Traffic Safety Along the Actual Route

    A destination may be close in distance but difficult to reach safely or comfortably.

    What public data can show

    The Toronto Police Service Public Safety Data Portal provides traffic-collision data and public maps. Its Killed or Seriously Injured collision resources contain information about collisions involving people who were killed or seriously injured from 2006 onward.

    This information can identify patterns and streets that deserve closer investigation. It cannot predict whether an individual trip will be safe.

    What to observe in person

    Follow the exact routes household members would use independently. Look at:

    • Sidewalk width and condition
    • Actual vehicle speeds
    • Crossing distance
    • Pedestrian signals
    • Turning traffic
    • Visibility at intersections
    • Driveway conflicts
    • Bicycle infrastructure
    • Curb cuts
    • Lighting
    • Winter maintenance
    • School-zone traffic

    Pay particular attention to the most difficult point in the route. A park 300 metres away may not be meaningfully accessible to a young child or older adult when reaching it requires crossing several lanes of fast-moving traffic.

    Faiza’s Field Note

    Distance is only one part of access. I pay close attention to the most difficult point in the journey. One uncomfortable crossing can become the reason a family stops walking to a park, school or transit stop.

    7. Use Crime Data Carefully and Responsibly

    Crime information can provide context, but it should not be used to place simplistic labels on entire communities.

    What public data can show

    The Toronto Police Service Public Safety Data Portal provides downloadable datasets, analytical tools and maps. Available information includes neighbourhood crime rates per 100,000 residents, occurrence data and traffic information.

    When reviewing the information:

    • Compare rates rather than only raw totals.
    • Separate different offence categories.
    • Examine several years when possible.
    • Consider the number of residents and visitors.
    • Look at the immediate surroundings as well as the broader neighbourhood.
    • Confirm how recently the data was updated.
    • Do not draw conclusions from one isolated incident.

    A downtown commercial area may record more incidents partly because far more people pass through it each day than the residential population suggests.

    Crime data also represents reported and recorded incidents. It cannot fully measure unreported events, lighting, street activity, visibility or how a particular person experiences a route.

    What to observe in person

    Visit after dark and walk between:

    • The property and transit
    • The property and parking
    • The property and frequently used amenities

    Observe:

    • Lighting
    • Sightlines
    • Active storefronts
    • Entrances and exits
    • Isolated stretches
    • Whether help would be accessible
    • How the route feels to the person who will use it

    Avoid using demographic information or neighbourhood reputation as a substitute for evidence.

    Faiza’s Field Note

    I would not tell a client that a neighbourhood is safe or unsafe based on a label. I help them locate the available information, investigate the specific routes they will use and form their own assessment of personal comfort.

    8. Inspect Parks and Green Space for Usability

    A green shape on a map is not necessarily a usable neighbourhood park.

    What the research tells us

    The World Health Organization’s review of urban green-space interventions and health connects urban green space with potential health, social and environmental benefits. Relevant pathways include physical activity, psychological restoration, social interaction and reduced exposure to environmental conditions such as heat. WHO also emphasizes that the results depend on design, accessibility, management and whether people actually use the space.

    The same WHO intervention review found that physical improvements can be more effective when combined with social engagement and programming. This reinforces the difference between simply having green land nearby and having a welcoming, functional public space.

    Public data you can check

    Toronto’s Parks and Community Recreation Centres Map allows users to locate parks and filter for amenities such as:

    • Playgrounds
    • Dog off-leash areas
    • Sports fields
    • Pools
    • Rinks
    • Fitness equipment
    • Community recreation centres

    The City also maintains a map of current and recently completed park and recreation projects, which may reveal upcoming construction or facility improvements.

    What to observe in person

    Ask:

    • Where is the nearest usable entrance?
    • Is the route accessible?
    • Are there benches and shaded areas?
    • Is there lighting?
    • Are the facilities relevant to the household?
    • Is the space maintained in winter?
    • Is it heavily occupied by organized activities?
    • Does it feel connected to the surrounding streets?
    • Is there somewhere to sit without making a purchase?

    A small park encountered during an everyday walk may contribute more to daily life than a large ravine or regional park that is difficult to enter.

    Think beyond standard playground equipment

    Usability also depends on how your household actually plays and learns. A park does not need a play structure to be valuable:

    • Children who prefer hands-on, constructive play may get more from logs, boulders, sand, loose sticks and uneven terrain than from a fixed climbing frame.
    • A naturalized garden, pond edge or meadow strip can be a daily destination for a child fascinated by insects, birds and pond life.
    • For some children — and adults — the best "park" is a bench with a clear view of a streetcar turning loop, a rail corridor, a busy bicycle intersection or a transit hub, where they can watch mechanical systems operate.
    • Open, unprogrammed lawn space supports invented games in a way that single-purpose equipment cannot.

    If someone in your household has a specific fascination, evaluate the neighbourhood for that interest directly, rather than assuming a standard playground will satisfy it.

    Faiza’s Field Note

    Buyers sometimes place significant value on a ravine or park shown beside the property. I look for the entrance. When the usable entrance is on the opposite side or requires a long detour, the practical benefit may be very different from what the map suggests.

    9. Investigate Heat, Air Quality and Tree Cover

    Neighbourhood environmental conditions can vary significantly across a city and even from one block to another.

    What the research tells us

    Research describing HealthyPlan.City as a Canadian neighbourhood-level environmental and equity tool explains that its indicators include air pollution, average summer temperature, green-space provision, noise, parks, transit and tree-canopy cover. The underlying research emphasizes that environmental factors such as heat, air quality and access to green spaces can influence public health.

    Highly walkable locations can also be close to heavy traffic. Canadian research examining the interaction between neighbourhood walkability and traffic-related air pollution illustrates why one positive neighbourhood characteristic should not automatically cancel out another environmental concern.

    Public data you can check

    HealthyPlan.City can be used to screen and compare supported neighbourhoods for:

    • Air pollution
    • Average summer temperature
    • Tree-canopy cover
    • Green-space provision
    • Noise
    • Flood susceptibility
    • Transit access
    • Community amenities

    The indicators represent neighbourhood-level estimates. They are not environmental tests of an individual home.

    What to observe in person

    Look for:

    • Mature street trees
    • Shade along walking routes
    • Large areas of exposed pavement
    • Highway ramps
    • Idling vehicles
    • Heavy truck traffic
    • Industrial uses
    • Exhaust outlets
    • Cooling spaces
    • Whether the home has adequate cooling and ventilation

    For an apartment, ask:

    • Does the unit have air conditioning?
    • Can the occupant control it?
    • Do the windows open?
    • Which direction does the unit face?
    • Is the bedroom exposed to strong afternoon sun?
    • Are common areas cooled?
    Faiza’s Field Note

    Tree canopy is not only about appearance. On a hot day, compare a route in full sun with one shaded by mature trees. The difference can affect whether someone is comfortable walking, waiting for transit or spending time outside.

    10. Check Flood Risk and Drainage

    Flood risk involves more than determining whether a property is beside a river.

    What public data can show

    The Toronto and Region Conservation Authority’s floodplain information provides an address-searchable floodplain viewer. Properties shown within mapped areas may be exposed to riverine flooding.

    However, riverine flood maps do not represent every type of water risk. TRCA’s explanation of different flood risks distinguishes river flooding from urban or pluvial flooding, which can include street flooding, basement flooding and overflow from local drainage systems. Municipalities are generally responsible for managing these urban drainage issues.

    Being outside a mapped river floodplain therefore does not prove that a property has no history or risk of water entry.

    What to observe and ask

    For a house, inspect:

    • Lot grading
    • Basement walls and floors
    • Window wells
    • Downspout direction
    • Sump pump
    • Backwater valve
    • Nearby low points
    • Retaining walls
    • Signs of staining or repairs
    • Nearby ravines and watercourses

    Ask about:

    • Previous basement water entry
    • Sewer backups
    • Drainage repairs
    • Insurance claims
    • Flood-protection improvements

    For a condominium or rental building, consider:

    • Underground parking
    • Below-grade lockers
    • Electrical equipment
    • Elevator equipment
    • Building drainage
    • Emergency procedures
    • Previous garage flooding
    Faiza’s Field Note

    A sunny showing presents a property at its easiest. When possible, I value what can be learned after heavy rain. Water pooling, drainage patterns and difficult walking routes become much easier to see.

    11. Research Planned Development

    You are not only choosing the neighbourhood that exists today. You may also be choosing the neighbourhood it is becoming.

    Public data you can check

    Toronto’s Application Information Centre provides information about active Community Planning, Committee of Adjustment and Toronto Local Appeal Body applications. Users can search by address, application type, ward, status and submission date. The City states that the information is refreshed daily, although application details and timelines may still change.

    Toronto’s Development Applications Open Data entry also covers active and inactive Community Planning and Committee of Adjustment applications.

    What to investigate

    Search the property and surrounding blocks for:

    • Rezoning applications
    • Site-plan applications
    • Minor variances
    • Proposed towers
    • Additions
    • Parking-lot redevelopment
    • Transit construction
    • Road reconstruction
    • New parks
    • Major institutional projects

    Potential benefits may include:

    • More housing
    • Better transit
    • New stores and services
    • Public-space improvements
    • Additional neighbourhood activity

    Potential disruptions may include:

    • Construction noise
    • Dust
    • Road closures
    • Changed views
    • Reduced sunlight
    • Increased traffic
    • Several years of nearby work

    An application does not guarantee that a project will be approved, built as proposed or completed on the expected schedule.

    Faiza’s Field Note

    An open view can feel like part of the property, but the land creating that view belongs to someone else. I encourage buyers to ask what is located on the neighbouring site and whether redevelopment is possible.

    12. Evaluate Schools Beyond Rankings

    Families should verify which schools actually serve the property.

    Public data you can check

    Ontario’s School Information Finder allows users to search publicly funded schools by municipality, postal code, school board or school name. The province also publishes school information and student-demographic datasets based on information reported by schools and boards.

    These resources are a starting point. The relevant school board should confirm:

    • Attendance boundaries
    • Registration eligibility
    • Program availability
    • Transportation
    • French immersion
    • Specialized programs
    • Before- and after-school care

    What to observe in person

    Walk the route at school arrival or dismissal time. Observe:

    • Crossing guards
    • Traffic congestion
    • Drop-off behaviour
    • Sidewalk conditions
    • Winter practicality
    • Travel time for a child
    • The location of bus stops
    • Whether the route is one the household would use consistently

    School-performance data should be treated as one limited indicator. It cannot capture every aspect of school culture, leadership, student support, facilities or compatibility with an individual child.

    Faiza’s Field Note

    I always recommend confirming school information directly with the board before making a housing decision. The closest school is not necessarily the assigned school, and boundaries or program availability can change.

    13. Renters Should Evaluate the Building, Not Only the Area

    A strong neighbourhood cannot compensate for a poorly maintained or badly managed rental building.

    Public data you can check

    Toronto’s RentSafeTO apartment-building evaluation program evaluates registered apartment buildings. As of July 2026, registered buildings are subject to evaluation every two years and receive a green, yellow or red sign based on their current score. The City provides an interactive building-score map, evaluation information and investigation activity.

    The evaluations inspect interior and exterior common areas and assess issues such as:

    • Exterior grounds
    • Drainage
    • Walkways
    • Doors and windows
    • Intercoms
    • Laundry rooms
    • Waste areas
    • Elevators
    • Lighting
    • Ventilation
    • Electrical conditions
    • Maintenance plans
    • Pest-control records

    Scores combine proactive inspection results with active violations and are refreshed daily on the City’s interactive map.

    RentSafeTO does not cover every type of rental home. A renter should verify whether the particular building is registered rather than assuming that every condominium rental, townhouse or privately owned unit appears in the program.

    What to observe and ask

    Inspect:

    • Lobby and hallways
    • Elevators
    • Garbage areas
    • Laundry facilities
    • Parking
    • Bicycle storage
    • Security systems
    • Package-delivery arrangements
    • Tenant-notification boards
    • Posted RentSafeTO signs

    Ask current residents practical questions where appropriate:

    • Are elevators frequently unavailable?
    • How are maintenance requests handled?
    • Is the building warm enough in winter?
    • Is noise transfer a recurring concern?
    • Have there been pest problems?
    • Are packages secure?

    For a condominium rental, clarify whether the unit owner, property manager or condominium corporation is responsible for each type of repair.

    Faiza’s Field Note

    Renters naturally focus on the unit because that is what they are applying for. I remind them that they are also choosing the elevators, hallways, management systems and shared spaces they will depend on every day.

    14. Look for Community Life and a Sense of Belonging

    Some neighbourhood characteristics cannot be reduced to a property-search filter.

    What the research tells us

    Statistics Canada research on neighbourhood social capital and community belonging notes that parks and green spaces may support belonging by creating opportunities for social interaction and contact with nature.

    A systematic review examining neighbourhood social cohesion, depression and anxiety also found evidence that neighbourhood social cohesion may help protect against depression and anxiety, although the researchers noted that the strength and quality of evidence vary and that more causal research is needed.

    These findings do not mean a brief visit can measure the social cohesion of a neighbourhood. They explain why opportunities for connection may be a legitimate part of evaluating quality of life.

    What to observe in person

    Look for:

    • People using public spaces
    • A range of age groups
    • Libraries
    • Community centres
    • Local events
    • Independent businesses
    • Public seating
    • Front porches
    • Community gardens
    • Public art
    • Heritage features
    • Streets that appear cared for

    Ask whether people only move through the neighbourhood or also spend time there.

    For some households, belonging may come through schools, recreation, cultural institutions or faith communities. For others, it may come from cafés, parks, local businesses or informal contact with neighbours.

    Faiza’s Field Note

    I like to observe whether people only pass through the neighbourhood or whether they also spend time there. Benches, libraries, parks and active storefronts can reveal whether the area provides opportunities for everyday neighbourhood life.

    15. Compare the True Monthly Cost

    The purchase price or monthly rent is only one part of the cost of living in a neighbourhood. Include:

    • Transit fares
    • Vehicle payments
    • Fuel
    • Parking
    • Insurance
    • Childcare
    • Utilities
    • Laundry
    • Storage
    • Commuting time
    • Delivery dependence
    • Recreation
    • Property maintenance

    For buyers, additional location-related expenses may include:

    • Property taxes
    • Condominium fees
    • Insurance restrictions
    • Flood-protection measures
    • Commuting expenses
    • Future special assessments

    For renters, they may include:

    • Utilities not included in rent
    • Parking
    • Laundry
    • Locker fees
    • Air-conditioning costs
    • Move-in charges
    • Frequent rideshare use when late-night transit is limited

    A more expensive property may offer better overall value when it allows the household to reduce vehicle use, shorten its commute or access services more easily.

    Conversely, paying a premium for amenities provides limited value when the household rarely uses them.

    Faiza’s Field Note

    I encourage clients to compare two realistic monthly budgets, not only two housing prices. Transportation and time can completely change which property is actually more affordable.

    16. Assess Pricing Stability and Market Resilience

    Most of this guide focuses on how a neighbourhood works day to day. Historical sold data adds a different lens: how the neighbourhood behaves as a market over time.

    What sold history can tell you

    Comparing several years of sold activity in a neighbourhood can help you understand:

    • Price trend and volatility — did typical sold prices move steadily, or swing sharply during slower markets?

    • Sold-versus-asking behaviour — do homes routinely sell above, at or below the asking price, and has that pattern changed?

    • Days on market — how long do properties typically take to sell, and does that stretch out significantly in slower seasons?

    • Transaction volume — is there consistent turnover year-round, or does the market rely on a brief spring window?

    • Re-listing patterns — are the same properties terminated and re-listed repeatedly before selling?

    A neighbourhood where prices dipped modestly and recovered during broader market slowdowns is demonstrating durable demand. One where prices swing widely, or where sales volumes collapse outside peak season, carries more timing risk — which matters if you might need to sell or break a lease on a schedule you do not control.

    How to check it

    On PropertyMesh you can browse recently sold properties and recently leased properties alongside active listings, then narrow to the specific city or area you are evaluating. Sold and leased price history is part of the Toronto Regional Real Estate Board’s VOW data, so a free account is required to view final sold prices.

    For renters, the same idea applies through lease data: how quickly do rentals in the building or area get taken, and are asking rents rising, flat or falling?

    Faiza’s Field Note

    When two neighbourhoods look similar on paper, I pull their sold history side by side. The one where prices held their ground in slow markets is telling you something about durable demand that no listing photo can show. I also look at how long homes sat on the market in the slowest quarter — that is the number that matters if you ever need to sell on someone else’s timeline.

    Put the Checklist to Work

    A live look at homes currently for sale in Toronto — pick one and try the three-visit test on its neighbourhood.

    A few useful starting points for applying this guide to a real search:

    • Condos for sale in Toronto — ideal for testing walkability, transit access and building management questions from sections 1, 3 and 13.

    • Rentals in Toronto — apply the renter-focused checks: building evaluations, included utilities and lease-period construction risk.

    • Homes in Toronto — where flood mapping, tree cover and future-development checks carry the most weight.

    • Recently sold properties — the raw material for the pricing-stability assessment in section 16.

    Buyers and Renters May Weight the Factors Differently

    Buyers generally carry more long-term property and financial exposure. Renters may be able to move more easily, but a difficult neighbourhood can still affect their time, budget and quality of life throughout the tenancy.

    Faiza’s Three-Visit Neighbourhood Test

    Before making an offer or submitting a rental application, complete these visits where possible.

    Visit One: The practical test

    Complete your commute and walk to the places you expect to use. Ask:

    • Can I complete ordinary errands conveniently?
    • Is the transit route realistic?
    • Would the route work in winter?
    • Am I comfortable with the transportation cost?

    Visit Two: The comfort test

    Return during the evening. Ask:

    • What can I hear?
    • How does the route feel after dark?
    • Is there adequate lighting?
    • Does the area become more active or less active?
    • Can I imagine sleeping and relaxing here?

    Visit Three: The weekend test

    Spend time in the neighbourhood rather than driving through it. Ask:

    • Who uses the parks and public spaces?
    • Are stores and services open?
    • Is visitor parking difficult?
    • Does the neighbourhood support how I spend my free time?
    • Would I enjoy being here when I am not inside the property?

    Write down your observations after every visit. Notes are more reliable than trying to remember several locations after a full day of showings.

    Neighbourhood Evaluation Scorecard

    Weighted fit analysis based on custom priority rules

    Overall Fit
    60%
    Category
    Score (1–5)
    Priority Weight
    Commute and transportation3/5
    3
    Walkability to useful destinations3/5
    3
    Grocery and essential services3/5
    3
    Traffic safety3/5
    3
    Noise and nighttime comfort3/5
    3
    Parks and outdoor space3/5
    3
    Schools or childcare3/5
    3
    Building condition and management3/5
    3
    Flood and environmental considerations3/5
    3
    Future development3/5
    3
    Community life3/5
    3
    Total monthly cost3/5
    3
    Long-term household fit3/5
    3

    Do not rely solely on the total score. A low score in an essential category should matter more than several high scores in optional categories.

    Research and Public Tools at a Glance

    What Data Cannot Tell You

    Public datasets are useful, but they have limits.

    Toronto’s Neighbourhood Profiles use 158 social-planning neighbourhoods created for research and service planning. Those boundaries do not always match the names used by residents, local businesses or real estate listings.

    Neighbourhood averages may also conceal major differences between individual blocks, buildings and intersections.

    Remember:

    • A mapped park may not have a convenient entrance.
    • A nearby transit stop may offer infrequent service.
    • Crime data cannot guarantee personal safety.
    • A walkability indicator cannot assess every sidewalk.
    • A flood map does not include every form of flooding.
    • A development application may change or never proceed.
    • A building score may not reflect a problem that began yesterday.
    • A daytime visit cannot reveal nighttime conditions.
    • A neighbourhood average cannot describe every street.

    Data is most useful when it tells you where to investigate further. It should support direct observation, not replace it.

    Final Thoughts

    A neighbourhood should not be evaluated as a collection of nearby amenities. It should be evaluated as the setting for your daily life.

    Research can identify conditions associated with physical activity, access, health, well-being and neighbourhood satisfaction. Public data can reveal patterns that may not be visible during a showing. But some of the most valuable information still comes from walking the route, listening to the street and imagining an ordinary Tuesday rather than an ideal weekend.

    As a broker, my role is not to declare that one neighbourhood is best for everyone. It is to help buyers and renters ask better questions, find reliable information and recognize details they might otherwise overlook.

    Before choosing a home, take time to evaluate the life that surrounds it.

    Explore Toronto neighbourhoods with real listings

    Search homes for sale and rent across the GTA, then walk the routes that matter to your daily life.

    Start Your Search
    Editorial Disclaimer & Legal Notice
    Editorial Note: This guide provides general educational information about evaluating neighbourhoods before buying or renting. It is an educational overview and does not reflect the specifics of any individual property or transaction.Public datasets may be delayed, incomplete or based on geographic boundaries that do not correspond precisely with an individual property.Buyers and renters should conduct their own due diligence and consult the appropriate agencies or qualified professionals where necessary.
    FA

    About the author:

    Faiza Ahmed

    As the founder of PropertyMesh, Faiza Ahmed is dedicated to making real estate more transparent and cost-effective. While she advocates for more transparent, flexible fee structures so sellers can keep more of their equity, her core focus is empowering buyers and sellers to make informed decisions. Faiza is a licensed real estate broker registered with the Real Estate Council of Ontario (RECO Registration #4791581) and an active member of the Toronto Regional Real Estate Board (TRREB).

    Follow the expert:LinkedIn
    Isometric illustration of a walking route from a house crossing a large surface parking lot and crosswalk to a grocery store
    A destination that looks close on a map can still involve a difficult route on foot.
    Isometric neighbourhood map showing connecting paths from a home to nearby amenities and services
    Evaluate the actual routes to services and amenities, not just a radius on a map.
    Split illustration of the same residential street during the day and at night with street lighting and pedestrians
    The same street can feel very different in daylight and after dark.
    Wide multi-lane intersection with a long crosswalk leading to a grocery store
    Crossing distances, signals and real vehicle speeds decide whether a nearby destination is comfortably reachable.
    Isometric illustration of an accessible neighbourhood park with benches, gardens, a café and people of all ages
    A functional public space welcomes all ages — not just a green shape on a map.
    Balance scale weighing a house with car, fuel and time costs against a house with bike and transit costs
    A lower housing payment can be offset by higher transportation and time costs.
    FactorBuyers should emphasizeRenters should emphasize
    Future developmentLong-term views, sunlight, construction and resale implicationsDisruption during the expected lease period
    Property conditionStructural, drainage and long-term maintenance exposureRepairs, building operation and habitability
    SchoolsCurrent and future household needsNeeds during the likely tenancy
    TransportationLong-term commuting and vehicle dependenceImmediate travel cost and convenience
    Building managementCondominium governance and financial healthMaintenance response and building evaluation history
    Climate riskInsurance, damage and resale implicationsPersonal comfort, access and protection of belongings
    FlexibilityFuture marketability and resaleLease terms and ability to relocate
    What you are evaluatingResearch or public resourceWhat it can help reveal
    WalkabilityStatistics Canada Can-ALE 2.0Built-environment support for active transportation
    Access to amenitiesStatistics Canada Proximity Measures DatabaseRelative access to services and amenities
    Access by travel modeStatistics Canada Spatial Access MeasuresPotential access by walking, cycling, transit and driving
    Combined location costsStatistics Canada Housing and Transportation Cost IndexHousing and transportation costs together
    TransitTTC Trip Planner, schedules and alertsRoutes, transfers, frequency and disruptions
    ParksToronto Parks and Community Recreation Centres MapPark locations and specific amenities
    Traffic safetyToronto Police collision and KSI dataHistorical collision patterns
    CrimeToronto Police Public Safety Data PortalReported incidents, categories and neighbourhood rates
    Heat and environmental conditionsHealthyPlan.CityHeat, air, trees, noise, transit and flood susceptibility
    Riverine floodingTRCA floodplain informationMapped river floodplain exposure
    Future developmentToronto Application Information CentreActive planning and development applications
    SchoolsOntario School Information FinderPublic-school information and locations
    Rental buildingsToronto RentSafeTOBuilding scores, evaluations and violations
    Neighbourhood contextToronto Neighbourhood ProfilesPopulation and socioeconomic information